
A Standardized Choropleth map illustrates data that has been areally averaged. The shadings in this map show how many people there are per square kilometer worldwide.


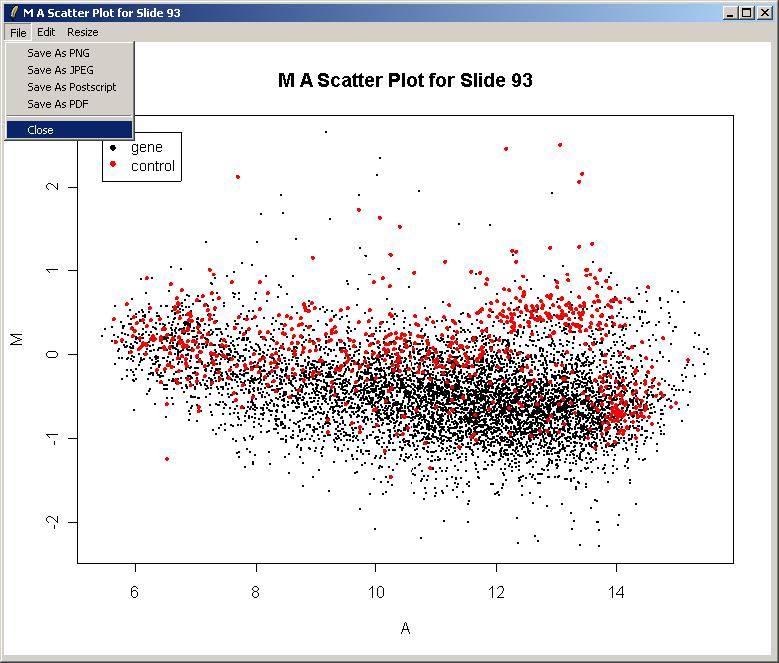
 This index value plot depicts the average streamflow index for eight years for the United States. Being graphed along the normal range shows the fluctuation for the streamflow variable.
 A Climagraph is a map graph that charts temperature and precipitation from month to month. This climagraph records a full year's data for Walgett, Australia. We can determine that the driest month was July.


 Someone needs to tell this tree to relax!


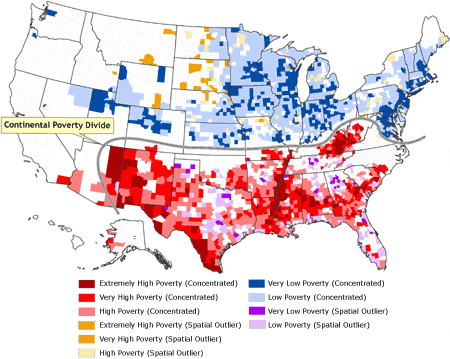
 This classed choropleth map shows data by color. Each color represents change in the variable.
 This map of Canada's provinces and territories is an example of the map style known as a Continuously Variable Proportional Circle Map. This tpe of a map uses a circle to show data rather than small dots. The bigger the circle, the bigger the variable.


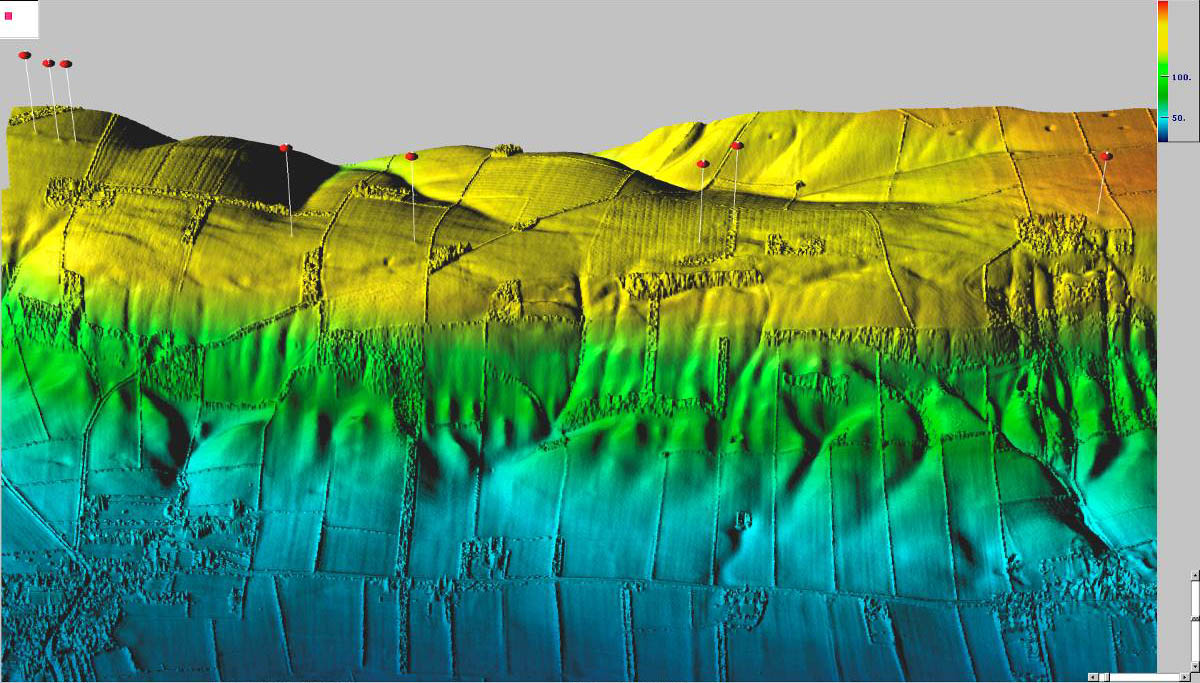
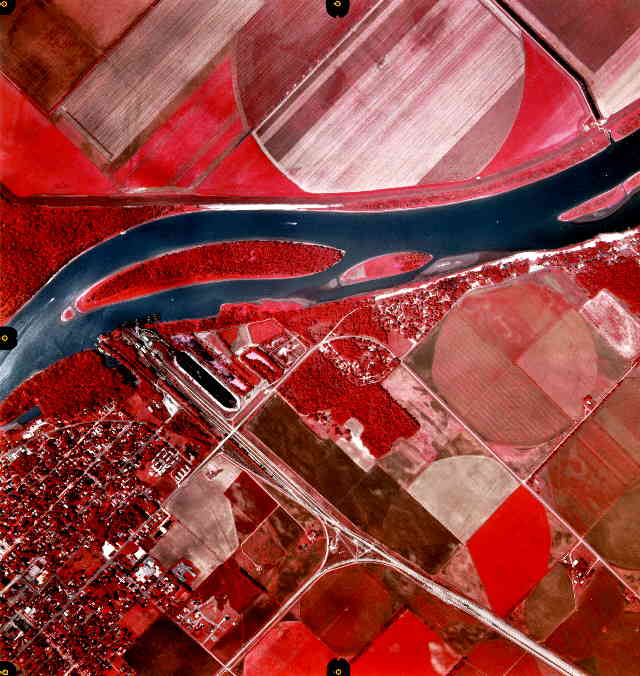
 This map shows how beautiful maps can be! This LIDAR image was made by laser rather than using radiowave or microwave radiation. It is useful for getting three dimensional images.
 http://www.tutorialsolutions.com/isolines.gif
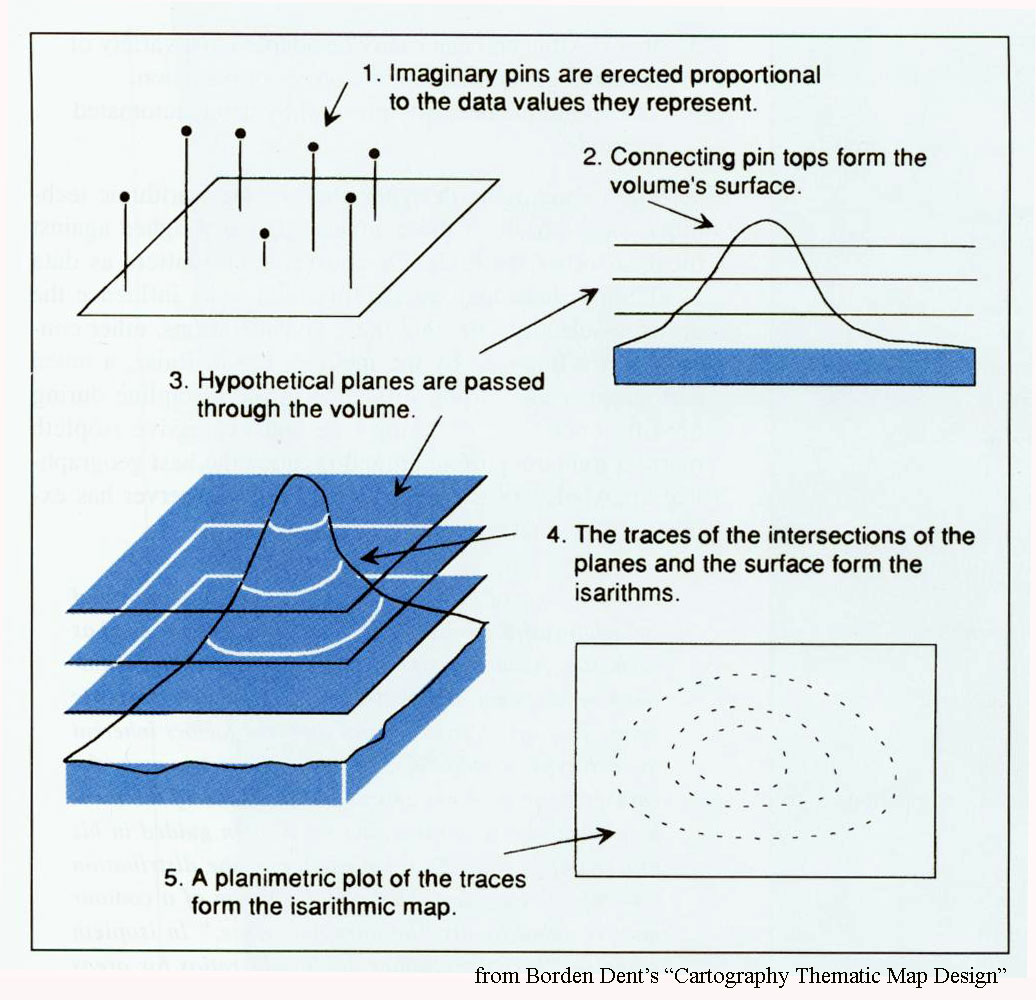
 Above shows how the isolines on a map are determined.
 http://www.iacm.gov.mo/cotaimuseum/photos/exhibits/30.jpg
 PLSS stands for Public Land Survey System. It is a type of systematic cadastral map. The principle meridians are equal to the base lines. This is the basis of this system. This map of Minnesota can be found at
 Statistical maps show the density where the variable is located. This map represents where metropolitan and micropolitan statistical areas are found in the United States and Puerto Rico.


