
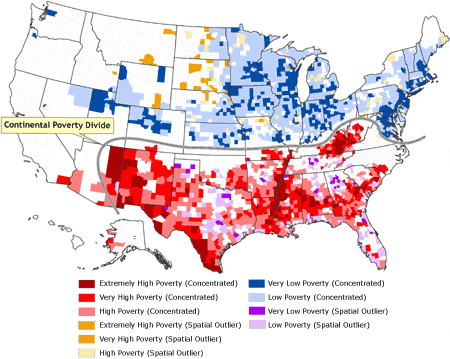
A Bivariate Choropleth Map is one that has more than one variable being represented. In addition to the colors showing differences in poverty levels, there is a "Continental Poverty Divide as well. It shows where the poverty is more densly located.
No comments:
Post a Comment