mapblog08-scoutstone
Blog Archive
▼
2008
(53)
▼
August
(41)
Standardized Choropleth Map
Lorenz Curve
Parallel Coordinate Graph
Index Value Plot
Population Profile Map
Climagraph
Windrose
Triangular Plot
Histogram
Unstandardized Choropleth Map
Bilateral Graph Map
Nominal Area Choropleth Map
Univariate Choropleth Maps
Bivariate Choropleth Maps
Box Plot
Stem and Leaf Plot
Similarity Matrix
Coorelation Matrix
Star Plot
Scatter Plot
Unclassed Choropleth Map
Classed Choropleth Maps
Range Graded Proportional Circle Map
Continuously Variable Proportional Circle Map
DOQQ (Digital Orthographic Quarter Quads)
DEM (Digital Elevation Models)
DLG (Digital Line Graphics)
Hypsometric
DRG (Digital Raster Graphics)
Cartographic Animation
Doppler
Isopleths
Isohyets
Isotachs
Isobars
LIDAR
Isopach
Black and White Aerial Photo
Isoline Map
Cadastral Map
PLSS (Public Land Survey System)
►
July
(12)
About Me
Jean Stone GIS 3015 SU/08
View my complete profile
Thursday, August 7, 2008
LIDAR
This map shows how beautiful maps can be! This LIDAR image was made by laser rather than using radiowave or microwave radiation. It is useful for getting three dimensional images.
http://www.sciencegl.com/3Dsurf/Shots/Lidar_1.jpg
No comments:
Post a Comment
Newer Post
Older Post
Home
Subscribe to:
Post Comments (Atom)
 This map shows how beautiful maps can be! This LIDAR image was made by laser rather than using radiowave or microwave radiation. It is useful for getting three dimensional images.
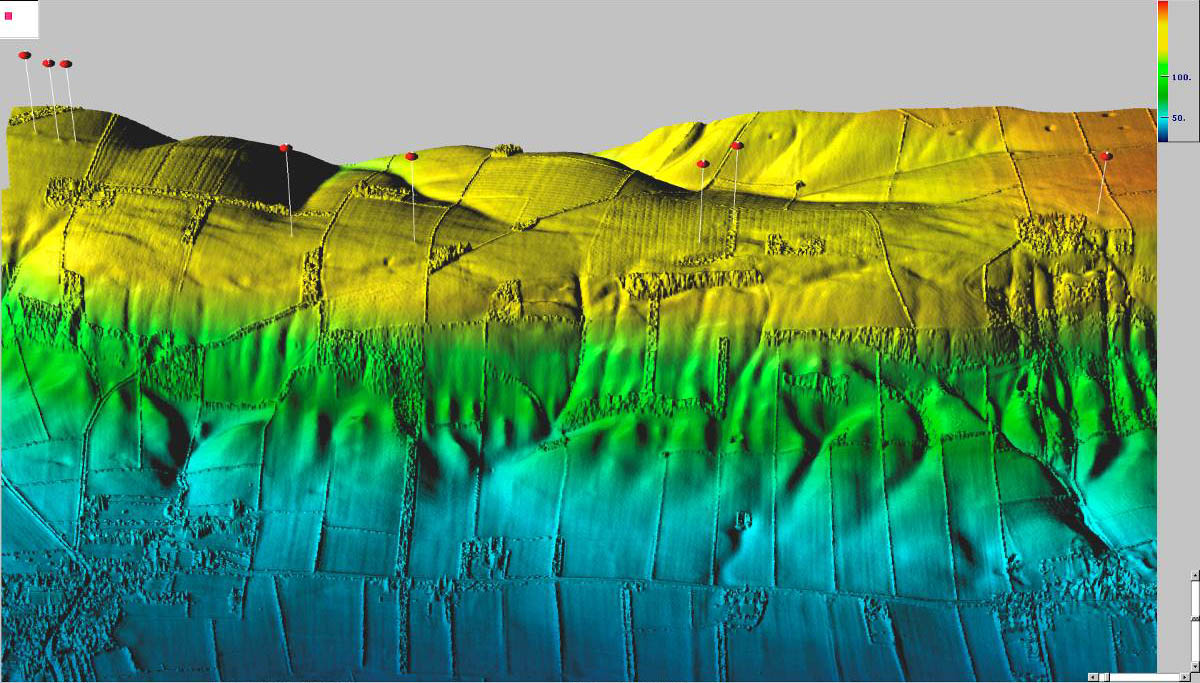
No comments:
Post a Comment