mapblog08-scoutstone

Blog Archive

  • ▼  2008 (53)
    • ▼  August (41)
      • Standardized Choropleth Map
      • Lorenz Curve
      • Parallel Coordinate Graph
      • Index Value Plot
      • Population Profile Map
      • Climagraph
      • Windrose
      • Triangular Plot
      • Histogram
      • Unstandardized Choropleth Map
      • Bilateral Graph Map
      • Nominal Area Choropleth Map
      • Univariate Choropleth Maps
      • Bivariate Choropleth Maps
      • Box Plot
      • Stem and Leaf Plot
      • Similarity Matrix
      • Coorelation Matrix
      • Star Plot
      • Scatter Plot
      • Unclassed Choropleth Map
      • Classed Choropleth Maps
      • Range Graded Proportional Circle Map
      • Continuously Variable Proportional Circle Map
      • DOQQ (Digital Orthographic Quarter Quads)
      • DEM (Digital Elevation Models)
      • DLG (Digital Line Graphics)
      • Hypsometric
      • DRG (Digital Raster Graphics)
      • Cartographic Animation
      • Doppler
      • Isopleths
      • Isohyets
      • Isotachs
      • Isobars
      • LIDAR
      • Isopach
      • Black and White Aerial Photo
      • Isoline Map
      • Cadastral Map
      • PLSS (Public Land Survey System)
    • ►  July (12)

About Me

Jean Stone GIS 3015 SU/08
View my complete profile

Thursday, August 7, 2008

Isoline Map

Isolines on maps are lines that connect points of equal value. All the area on the same line will share the same variable, such as the temperature.

http://www.tutorialsolutions.com/isolines.gif


http://mapmaker.rutgers.edu/355/isoline_schematic2.jpg

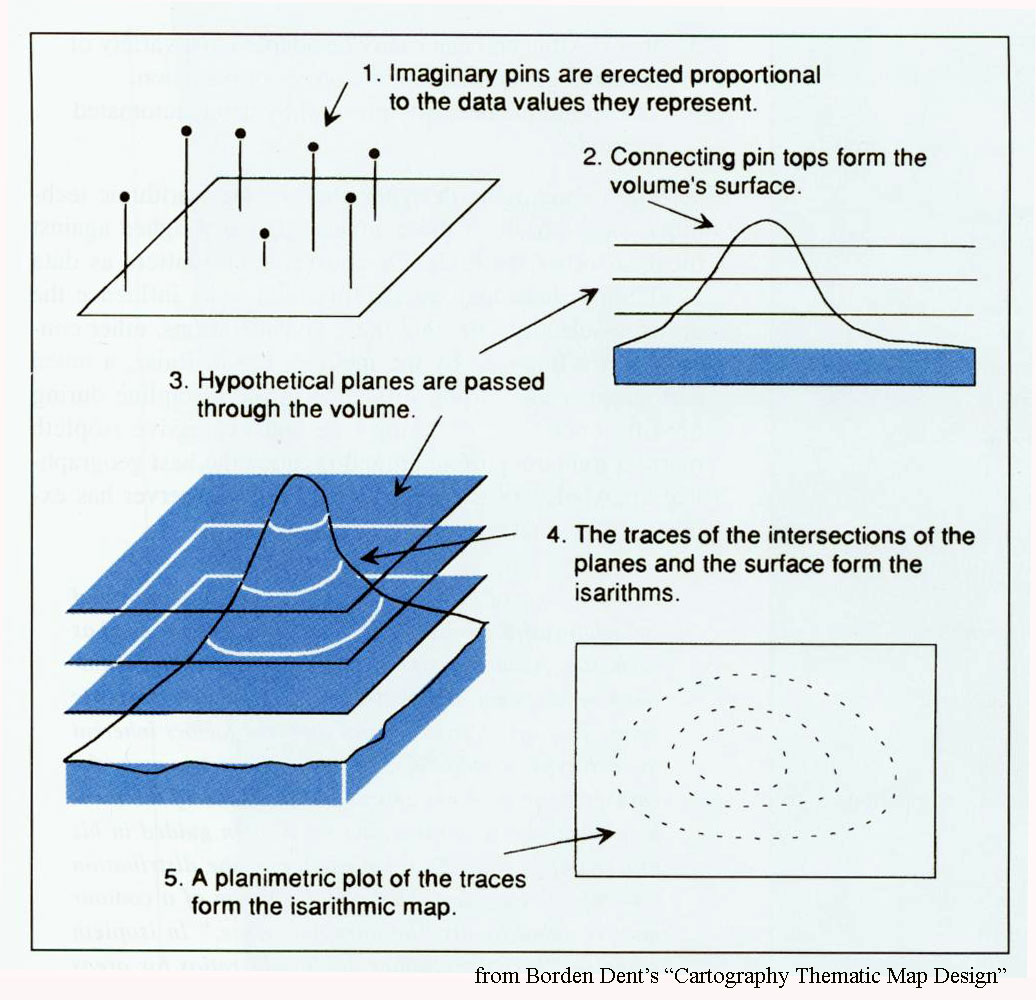
Above shows how the isolines on a map are determined.

Posted by Jean Stone GIS 3015 SU/08 at 7:22 PM

No comments:

Post a Comment

Newer Post Older Post Home
Subscribe to: Post Comments (Atom)