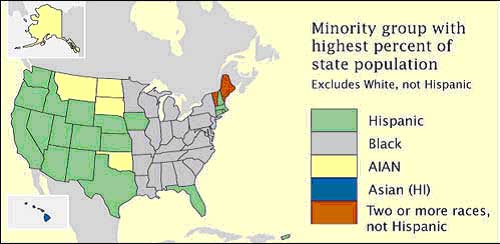
A Triangular is a type of graph that shows three variables. The one below shows the relationships between three political philosophies (parties) and how they voted.
This Unstandardized Choropleth map represents vacancies by zip code for an area. It is considered unstandardized, because it has not been areally averaged.
This Bilateral Graph map shows more than one variable being displayed. The legend shows which agency is involved, and which resources are managed by whom.
This is a Nominal Area Choropleth map. The data being represented is nominal, meaning this map of the world shows the Gross Domestic Product for different nations. The amount of the GDP is defined by color shades.
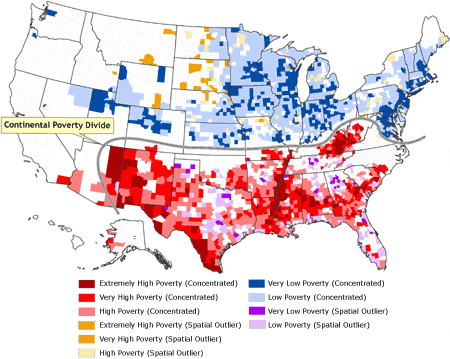
A Bivariate Choropleth Map is one that has more than one variable being represented. In addition to the colors showing differences in poverty levels, there is a "Continental Poverty Divide as well. It shows where the poverty is more densly located.