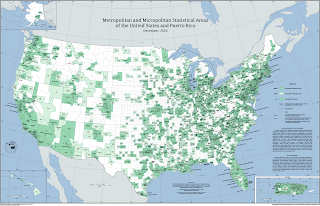
 Statistical maps show the density where the variable is located. This map represents where metropolitan and micropolitan statistical areas are found in the United States and Puerto Rico.
For a better view of this map, click on the link below.
http://www.novoco.com/new_markets/resource_files/maps_data/cbsa_us_1203_large.gif
No comments:
Post a Comment